Part One: The Masterclass
First in our industry to be responsible AI certified
Learn more →Part One: The Masterclass
Internal communicators measure plenty. Open rates, click-throughs, attendance, views, and reach—most IC teams have dashboards full of the stuff. What they struggle with is proving that any of it made a difference to the business. And business impact is the only measurement their leaders genuinely care about.
It's a gap most IC practitioners feel acutely. Gallagher's 2026 Employee Communications Report found that seven in 10 internal communicators still measure only basic activity metrics, and fewer than one in eight measure business impact. Measurement is the weakest capability in their global readiness model, and teams relying only on activity data are the ones struggling most to demonstrate their value.
This is a two-part guide built to close that gap.
Part One is the Masterclass. It sets out why outcome measurement matters, the frameworks that make it manageable, and the principles separating measurement that proves impact from measurement that just fills a dashboard.
Part Two is the Playbook. It's the templates, the worked example, and the sample dashboard—the practical tools you'll need for a successful comms campaign.
Read the Masterclass for the thinking. The Playbook is where you'll find the tools to put it into practice.
We hope you find them useful.
Tim Vaughan
Editorial Director, Poppulo
Part One
The why, the frameworks, and the principles behind measurement that proves impact. Read more.
Part Two
Templates, a worked example, and a sample dashboard that turn the thinking into practice. Read more.
You’ve all been there and have the very worn T-shirt. A campaign lands. The email went out, the town hall ran, and the intranet article is live. And then someone asks the question every IC practitioner gets asked sooner or later: did any of it actually work?
You reach for the numbers closest to hand. Eighty-seven percent open rate. A thousand views on the video. Strong attendance at the town hall. Defensible numbers, but they answer a different question from the one being asked.
The leader in front of you wants to know whether the communication changed anything—whether managers are running performance reviews differently, whether the new safety protocol is being followed on the floor, and whether employees understood something by Friday they hadn’t understood on Monday. Opens, views, and attendance can’t tell you any of that. They confirm the activity happened.
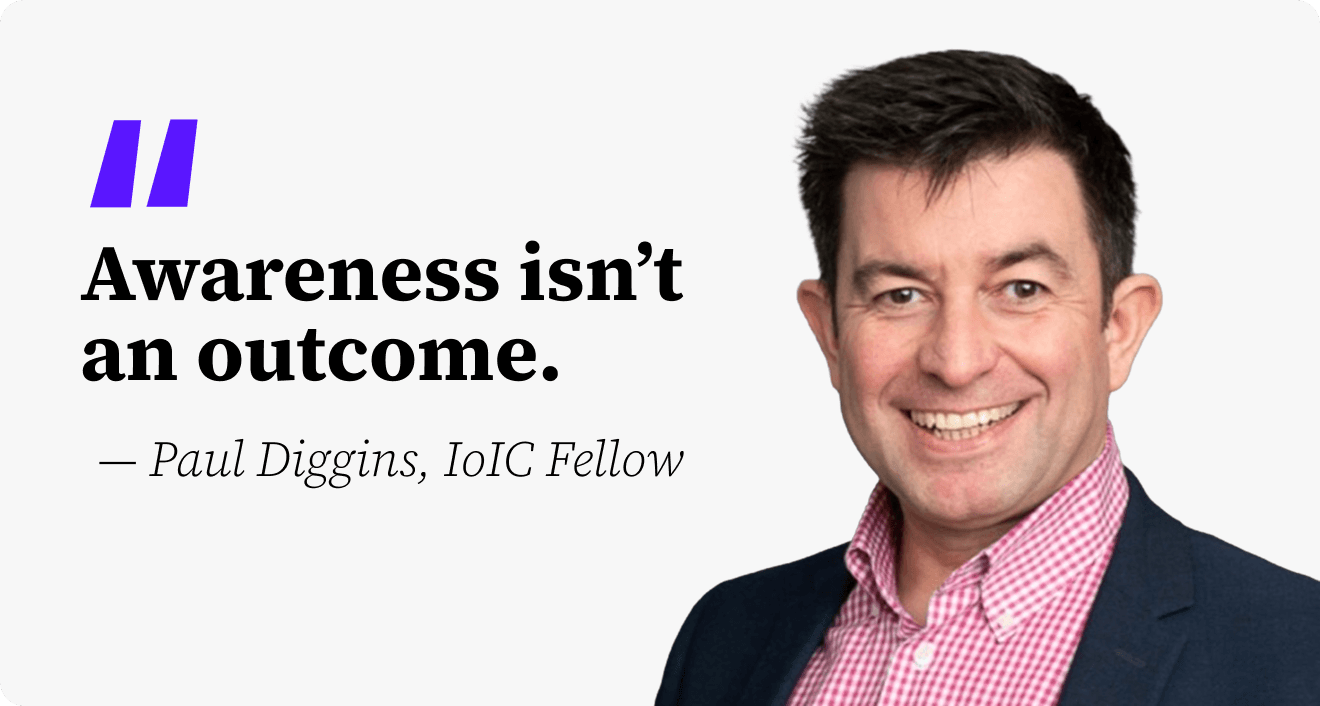
Paul Diggins, a Fellow of the Institute of Internal Communication, has a four-word formulation that captures the problem better than any textbook: awareness isn’t an outcome.
Awareness is where the work begins, not where it ends.
Outcomes are what the business is actually paying IC to deliver.
Most practitioners know this, and most IC teams are already measuring, often prolifically. Dashboards, weekly reports, campaign wrap-ups, and the full machinery of data collection. The problem is what's being measured; and more importantly, what's not being measured. Gallagher's 2026 Employee Communications Report makes the picture stark.

70% of communicators still measure only basic activity metrics

Only 16% measure outcomes such as understanding or sentiment

Only 12% measure business impact or ROI
Source: Gallagher Employee Communications Report 2026 (Global).
Impact is the lowest-scoring capability in Gallagher's global readiness model.
Teams relying on activity metrics are far less likely to exceed objectives.
Ruck and Field's Valuing Internal Communication research goes further into why this happens. When they surveyed practitioners about proving value, more than half said it remained difficult. Their diagnosis is worth thinking about. IC plainly creates value—the evidence is overwhelming. What practitioners often aren't doing is measuring the value they're creating. A team sends the newsletter and tracks the open rate, when the real contribution was that three weeks later, the new operating model was being adopted ahead of schedule because managers felt confident explaining it.
Furthermore, scrutiny has intensified. AI has pushed leadership teams to ask harder questions about what every function delivers, and how that delivery is evidenced. Budgets are being examined more carefully. Headcount requests pushed back on. Any function that can't evidence its contribution is having a tougher conversation with its board—and IC has historically been one of those functions.
Practitioners who can show how their work moved trust scores or accelerated change adoption are going to be fine.
At the same time, the tools available to IC teams are beginning to shift. As Jo Hall has written in Can Agentic AI Finally Solve Internal Communication's Measurement Problem?, the issue has rarely been a lack of data—it's the effort required to access it, connect it, and turn it into something meaningful.
None of this requires abandoning the output data you're collecting, but it does change how you use it. And you need to add to it—a way of thinking about what communication is actually meant to achieve, and the discipline to build campaigns so outcome data gets captured alongside the outputs. That's where we go next in Chapter 2.

Agentic AI will ease that burden, but the principle doesn't change. Too many IC teams start with the data they have rather than the outcome they were trying to achieve — and if that's your starting point, better tools will only get you to the wrong answer faster.
If outcomes are what leaders want to see, the next question is what they actually look like, and how IC teams get from outputs to outcomes.
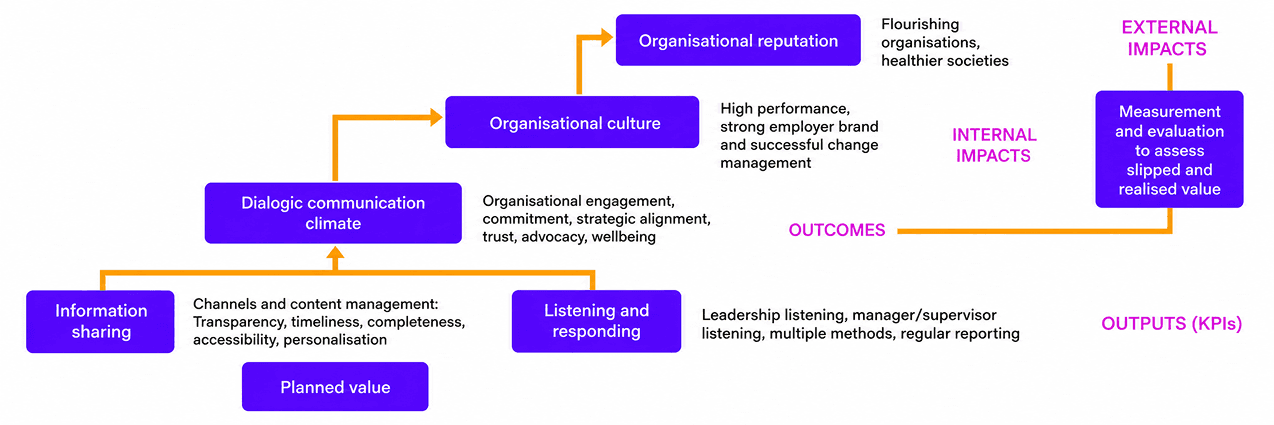
Here's a good way to start. Dr. Kevin Ruck and Jenni Field's Valuing Internal Communication report includes something called the Internal Communication Value Ladder. It's a single diagram that shows how communication creates value, rung by rung, from the groundwork of research and planning all the way up to organizational reputation and external impact.
At the bottom of the ladder sit the inputs—the formative research, the objectives, and the KPIs you set before you start. This is the planning layer. What are you trying to achieve? How will you know if it worked?
Above that come the outputs themselves: the content, the channels, and the messages. Newsletters, town halls, and intranet posts. The activity layer, and where most IC measurement currently lives.
The next rung is the one most dashboards miss—listening and responding. The two-way side of communication. Feedback loops, pulse surveys, manager roundtables, and the signals that tell you what's landing and what isn't. When an organization does this consistently, Ruck and Field describe what emerges as a “dialogic communication climate”—a culture where sharing and listening are both normalized, and where people feel heard as well as informed.
Outcomes appear at the next rung up. Engagement, alignment, trust, advocacy, and wellbeing—the things leadership actually cares about. The rungs above those describe internal impacts like organizational culture, strong employer brand, and successful change. And at the top, external impacts: reputation, advocacy beyond the organization, and the kind of thing that shows up in how customers and candidates see you.
Source: Gallagher Employee Communications Report 2026 (Global).
The ladder also clarifies some language that tends to get used interchangeably in IC conversations.
Most IC reporting stops at outputs and outtakes (see definitions on the right). The rest of Part One is about getting further up the ladder.
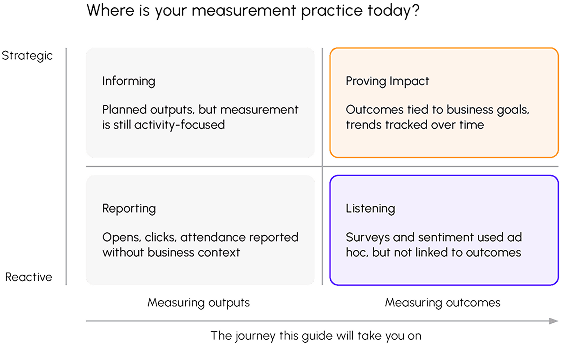
A quick diagnostic first. Where your practice sits right now will shape how useful the rest of this guide is for you. The grid below plots two dimensions—what you measure, and how. Outputs versus outcomes. Reactive measurement after the fact, versus strategic measurement built into how campaigns are designed. Most IC teams recognize themselves in one of the four quadrants.
Most of the difficulty IC practitioners have proving impact starts at the planning stage, long before the measurement question gets asked. A campaign that wasn't designed with outcomes in mind can't be retrofitted to prove them.
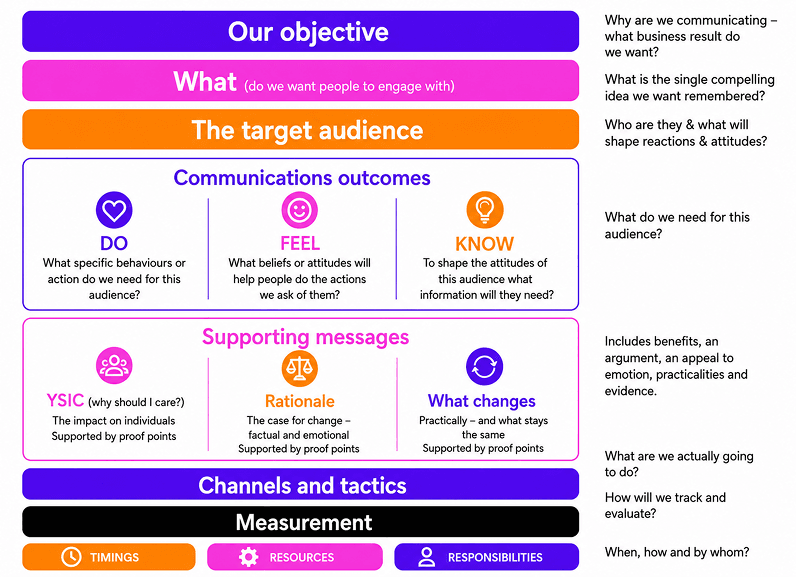
A useful framework for this comes from Liam FitzPatrick and Klavs Valskov's Internal Communications: A Manual for Practitioners. It's been around since 2014 and it still holds up. The framework runs top to bottom through the elements of a plan. Measurement sits at the bottom because it's the direct consequence of everything above it—you can only measure what you planned for.
Source: FitzPatrick and Valskov, Internal Communications: A Manual for Practitioners (2014)
It starts with the objective, and the objective has to be a business one. What's the change the business is trying to make? A ten percent reduction in safety incidents. Higher take-up of a new mentoring program. Managers who can explain next year's strategy to their teams without fudging it.
Next comes the what—the single compelling idea you want people to remember, in one line rather than a paragraph. "Everyone plays a part in safety." "Performance reviews are about growth." "AI helps us work smarter, safely, and ethically." The line has to survive being forgotten for a week and still come back when someone needs it.
Then the audience. Who are we talking to, and what will shape their reactions? Managers care about different things from frontline teams, and senior leaders care about different things again. This is where you have to think carefully about who you're actually talking to—their concerns, their access to information, and what they need from you.
Then the outcomes themselves, using the know/feel/do framework that threads through the rest of this guide. What do we want the audience to know — the information that shapes their understanding? What belief or emotional relationship to the change do we want them to hold? And what specific behavior or action are we looking for?
Get those three things right at the planning stage, and measurement stops feeling like a separate exercise bolted on at the end. You're simply checking whether the audience knew, felt, and did what you set out to achieve.
Below that come the supporting messages. The "why should I care?" question, asked from the audience's perspective. The rationale for change. What's different, and what stays the same. This is where IC earns credibility: by being honest about what's changing and useful about how to navigate it.
Only after all of that do channels and tactics enter the picture. And this is where a lot of IC planning goes wrong in practice—because stakeholders often arrive with the tactic already chosen. "We need an email. We need a town hall. We need a video." Sometimes they're right. Often they're reaching for whatever worked last time, without having done any of the thinking above.
A good IC practitioner pushes back here, without being combative about it.
Measurement is the final row. How will we know if this worked? By now, if the planning has been done properly, the answer falls out naturally. Behavior-change objectives point toward completion and participation rates. Alignment objectives lend themselves to pulse questions on whether people understand what's changing. Trust objectives need qualitative signals—how people talk about leadership in town halls, team channels, and one-on-ones—because the shift rarely shows up cleanly in numbers.
Time to make all of that practical. How do you actually define outcomes, and how do you build the measurement into a plan from the start?
The know/feel/do framework introduced in the last chapter does most of the work here. It forces a specific answer to the question “what is this communication for?” Vague intentions don’t survive it. “Build engagement with the new strategy” doesn’t translate cleanly into know, feel, or do. But “ensure every line manager can articulate the three strategic priorities to their team, feels equipped to answer questions about what it means for their work, and holds a team conversation about it within two weeks of launch”—that’s specific enough to plan against and measure.
Before drafting any content, sit down with the stakeholder and work through the three columns.
Know. What specific information does the audience need? Not everything you know about the topic—the minimum required for them to act on it. If there are five bullet points you think they should know, pressure-test each one. Would the communication fail without it? If not, cut it.
Feel. What belief or emotional disposition do you want the audience to come away with? Confident that the change is being well-managed. Trusted to make a local judgment about how to implement it. Reassured that their concerns have been heard. “Feel” is the rung most likely to get skipped, and often the one that determines whether the “do” actually happens.
Do. What specific action do you want them to take, and by when? Attend a briefing, complete a training module, run a team conversation, or change a specific working habit. The more concrete the action, the easier to measure.
Once Know, Feel, and Do are defined, the rest of the plan falls into place. You know exactly what the audience needs to walk away with, so the messaging follows naturally. Measurement does too, because you know what you’re looking for evidence of.
To see how this plays out in practice, take an AI policy rollout. The business wants employees using new tools productively while staying on the right side of data and security requirements. Run it through the three columns and you quickly see where the real communication work sits—and it isn’t in explaining the policy. It’s in making sure people feel enabled rather than policed, and confident enough to act rather than freeze. That distinction, between what the policy says and how people relate to it, is exactly what the framework surfaces. Get the know/feel/do right, and the campaign brief, the messaging, and the measurement all follow from it.
The worked example—AI policy rollout, mapped end-to-end through every template—is in Part Two.
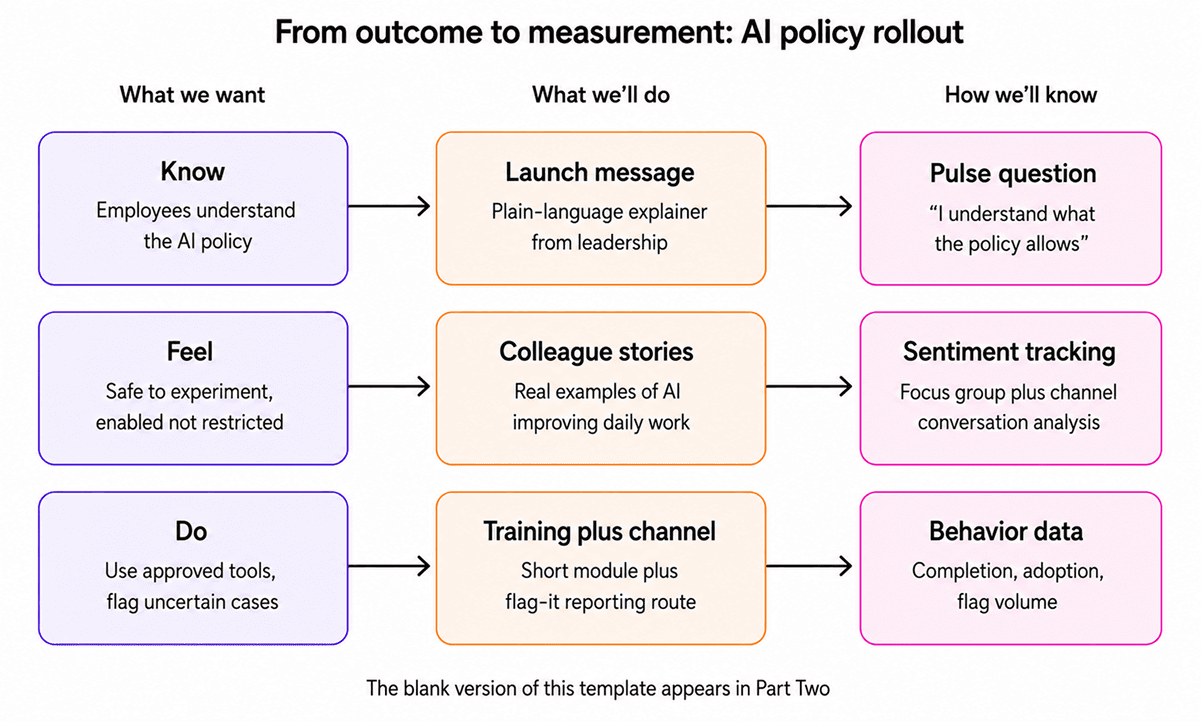
One more discipline worth applying: write one or two of your top-level objectives in SMART form. Specific, Measurable, Achievable, Relevant, and Time-bound. Not everything needs to be SMART, but a few campaign objectives expressed this way sharpens the whole plan. “90% of employees complete the AI policy training by September 30” passes the SMART test. “Employees engage with the AI policy content” doesn’t come close. And when someone asks at the end of the campaign whether it worked, the SMART target is the number you point to—90% set, 94% delivered—rather than reaching for open rates and hoping they mean something.
Every plan covered so far has treated the audience as a single block of people. That’s rarely how communication actually works. A campaign that treats senior leaders, middle managers, frontline staff, and office-based teams as one audience tends to patronize some of them and lose others—sometimes both at once. Segmenting properly is what separates communication that reaches people from communication that spreads itself too thin.
Jo Hall’s workbook offers a five-step approach to audience mapping worth following in order: segment, specify, focus, monitor, and measure. The power/influence grid that supports this—blank and ready to use—is in Part Two of this guide, The Playbook.
Here’s how it works. Start by breaking your audience into groups that matter for this specific campaign—which might not be the same groups that mattered last time. For the AI policy example, the relevant segments might be knowledge workers who’ll use AI tools daily, line managers responsible for team compliance, and frontline roles where AI exposure is limited but policy awareness still matters. A safety campaign would segment along entirely different lines.
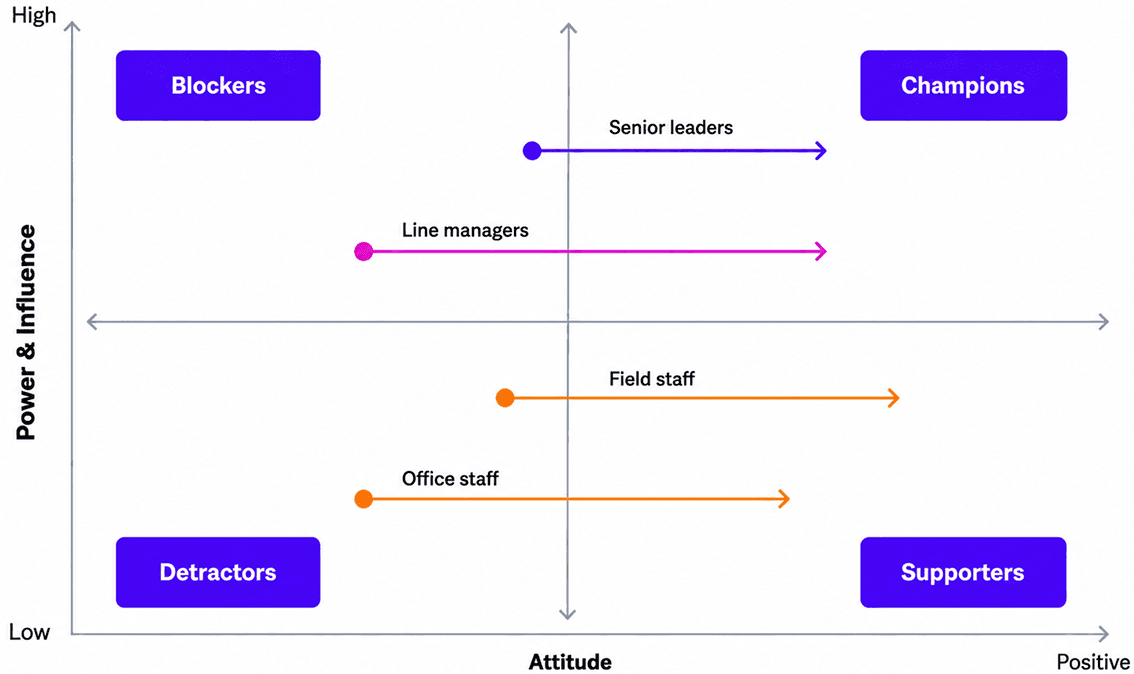
The grid tells you where to concentrate effort. Blockers need to be neutralized, usually through direct engagement. Detractors are best contained rather than converted. Supporters need activating within their teams. Champions need equipping to advocate on your behalf. A campaign that ignores the grid ends up shouting at everyone equally, with resources too thin to shift anyone decisively.
Each segment also needs its own measurement logic. Proving impact with line managers looks different from proving it with frontline teams. Managers might need to demonstrate they can confidently explain the AI policy to their team—measurable through a manager pulse or by listening in on team meetings. For frontline staff, the bar is lower: recognizing the policy exists and knowing where to find it, which a simple awareness check picks up. One dashboard for the campaign, with different rows for different groups.
Once the data starts arriving, the next discipline is interrogating it. Most IC teams rush this part—the data lands, looks roughly as expected, goes into the next slide deck, and the more interesting questions never get asked.
Jo’s framework for interrogating data is built around four questions. The first two do most of the work.
Why am I measuring this? If you can’t answer what this data point is supposed to tell you, it shouldn’t be in your report. Cut data that’s there only because it was easy to collect. A short report that makes a clear case does more work than a comprehensive one with the signal buried.
So what? Every measurement claim has to survive this question. The email had a 72% open rate. What does that tell us about whether the campaign is working? The answer “not much on its own, but combined with the pulse data it suggests managers are actively sharing the content” is reportable. The answer “it’s a good open rate” puts you back in vanity territory.
The other two questions—are my questions unambiguous, and who else might have valuable data—come into play when you’re designing the measurement and stitching together evidence from across the organization. HR often has attrition and exit-interview data that speaks directly to IC impact. IT holds the tool adoption numbers. Operations teams track performance metrics the comms team rarely sees.
Knowing what exists across the business, and asking for what’s relevant, produces a much richer picture than working from your own dashboards alone.
This is also where agentic AI is starting to change what’s practical. Jo argues in Can Agentic AI Finally Solve Internal Communication’s Measurement Problem? that these tools can help connect fragmented data and surface patterns across campaigns and channels far more quickly than manual analysis.
The discipline, though, stays the same. AI can accelerate the work, but it can’t decide what matters. The communicator still defines the outcome and interprets the insight.
And then there’s presentation. Plenty of strong measurement work dies on the way to the leadership team because the data is shared in a form leaders can’t absorb quickly. A spreadsheet with twenty tabs rarely travels. A single chart showing engagement trending upward over four quarters against a benchmark does.
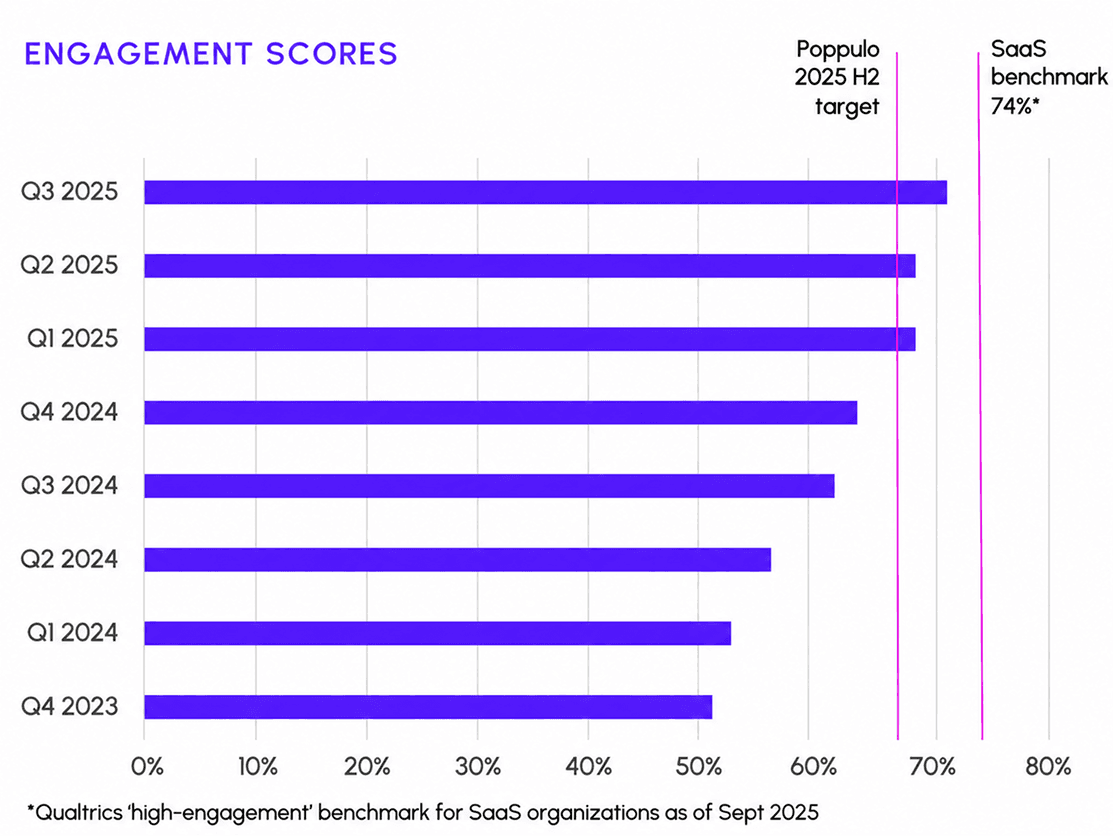
A few principles for visualizing for leadership. Images get processed and remembered more readily than tables. Start with the outcome you set out to achieve, and show the data against it. Tailor the view to the audience: a CFO will want different charts from a Chief People Officer. Mix visual types when you have multiple messages. Use no more than two or three colors, ideally from your brand palette. Cite your sources.
One more thing, and it matters more than most IC teams give it credit for: tell it as a story. Here’s where we started, here’s what we did, here’s what changed, and here’s what we recommend. That kind of report lands differently from one that just lists findings. It’s making a case, not just presenting data.
The earlier chapters covered the frameworks. What follows is the day-to-day tactical work—the things IC practitioners actually run into when they try to measure properly inside a real organization.
Start with the strategic priorities. If you don’t know where to anchor your measurement, read your organization’s strategic plan and work from what’s already there. The business will usually be trying to raise customer satisfaction, improve safety performance, lift operational efficiency, or deliver a program of change. Each of those priorities translates into an IC goal, and each goal has its own natural measurement approach. The IC team ends up measuring what the business already measures. That’s what makes IC meaningful to leadership.
Starting from business priorities shifts the conversation outward. Instead of an IC team deciding what to measure in isolation, you end up in a dialogue with the business about what matters. If the business is trying to raise customer satisfaction scores, the IC goal becomes bringing customer-first behaviors to life internally—and the measurement becomes CSAT trend data, call-handling times, and sentiment before and after the campaign.
Benchmark over time. A measurement snapshot tells you very little on its own—a 62% engagement score means almost nothing in isolation. The same number with context behind it (up from 54% a year ago, against a SaaS industry benchmark of 74%) starts to mean something. Trends carry the story. The quarterly engagement chart in Chapter 5 works because the direction of travel across quarters is doing the talking.
The implication for your practice is to start tracking things early and consistently, even when the first data points feel unimpressive. What you’re building is a baseline. Six months on you’ll be able to show movement; a year on you’ll have a proper narrative. Teams that wait until they have “something to show” before measuring systematically spend their careers a year behind where they could be.
Tackle survey fatigue. The most common objection to running proper pre- and post-campaign measurement is that employees are already drowning in surveys. Fair point—and worth taking seriously.
The Playbook's measurement plan template in Part Two of the guide is where these tactics get structured into a working campaign plan—with columns for outcome, audience, communication tactic, and measurement approach sitting alongside each other.
AI tools are shifting what’s realistic for a small IC team to measure—focus group transcription done in minutes, sentiment analysis across hundreds of Viva Engage comments, and dashboards drafted from raw data. None of this replaces the judgment part. Knowing which questions to ask, which insights matter, and how to present them to leadership is still human work.
As Jo notes, these tools don’t understand context or intent in the way a communicator does. They can surface patterns, but they can’t decide what the story means for your business.
Don’t try to separate IC impact from everything else. This one trips practitioners up. When engagement scores rise during a quarter that also included a bonus payment and a benefits relaunch, the temptation is to claim full credit, or to disclaim any of it. Both responses miss the point. The honest approach is to name the other factors explicitly in the reporting: “engagement rose six points this quarter; IC activity contributed alongside the bonus announcement and the benefits launch.” Leaders generally respect that kind of honesty about attribution, and distrust claims that reach beyond what the data will support.
Part One has covered a lot of ground. If it feels like more than you can apply tomorrow morning, here are four things you can do this week to start shifting your practice. Better measurement is built in small steps, and these are deliberately early ones.
One. Reframe what you measure on one live campaign.
Pick something currently in flight—a live campaign, a project mid-rollout, or a recurring communication like a weekly newsletter. Look at how you’re currently measuring it, then ask what outcome you wish you’d captured. Check whether the data for that outcome already exists somewhere in the organization. Often it does—HR holds engagement data, IT tracks tool usage, and operations teams monitor performance indicators that nobody has thought to connect to the comms work. The campaign may be closer to a real outcome measure than it looks, but connecting it to the right data requires someone to go looking.
Two. Link your next campaign to a business goal, in writing.
Take the next campaign brief on your desk and write one line under the title: This supports… followed by the business priority it connects to. Something like “This supports the customer satisfaction target” or “This supports our safety performance goal for the year.” Use that line in the stakeholder briefing that follows.
It does two things at once. The campaign gets anchored in a business outcome from the start. And the conversation with the stakeholder shifts from “what do you want to say?” to “what change are we trying to create?”
Three. Add a before-and-after pulse to your next campaign.
One question, asked before the campaign launches and asked again after it lands. “I understand what’s expected of me” is a reliable all-purpose version—adjust the wording to the campaign at hand. Sophisticated tooling isn’t required. A single question added to an existing pulse survey, or a Slack poll to a representative group, is enough to show movement. The point is capturing the change, not just where things landed.
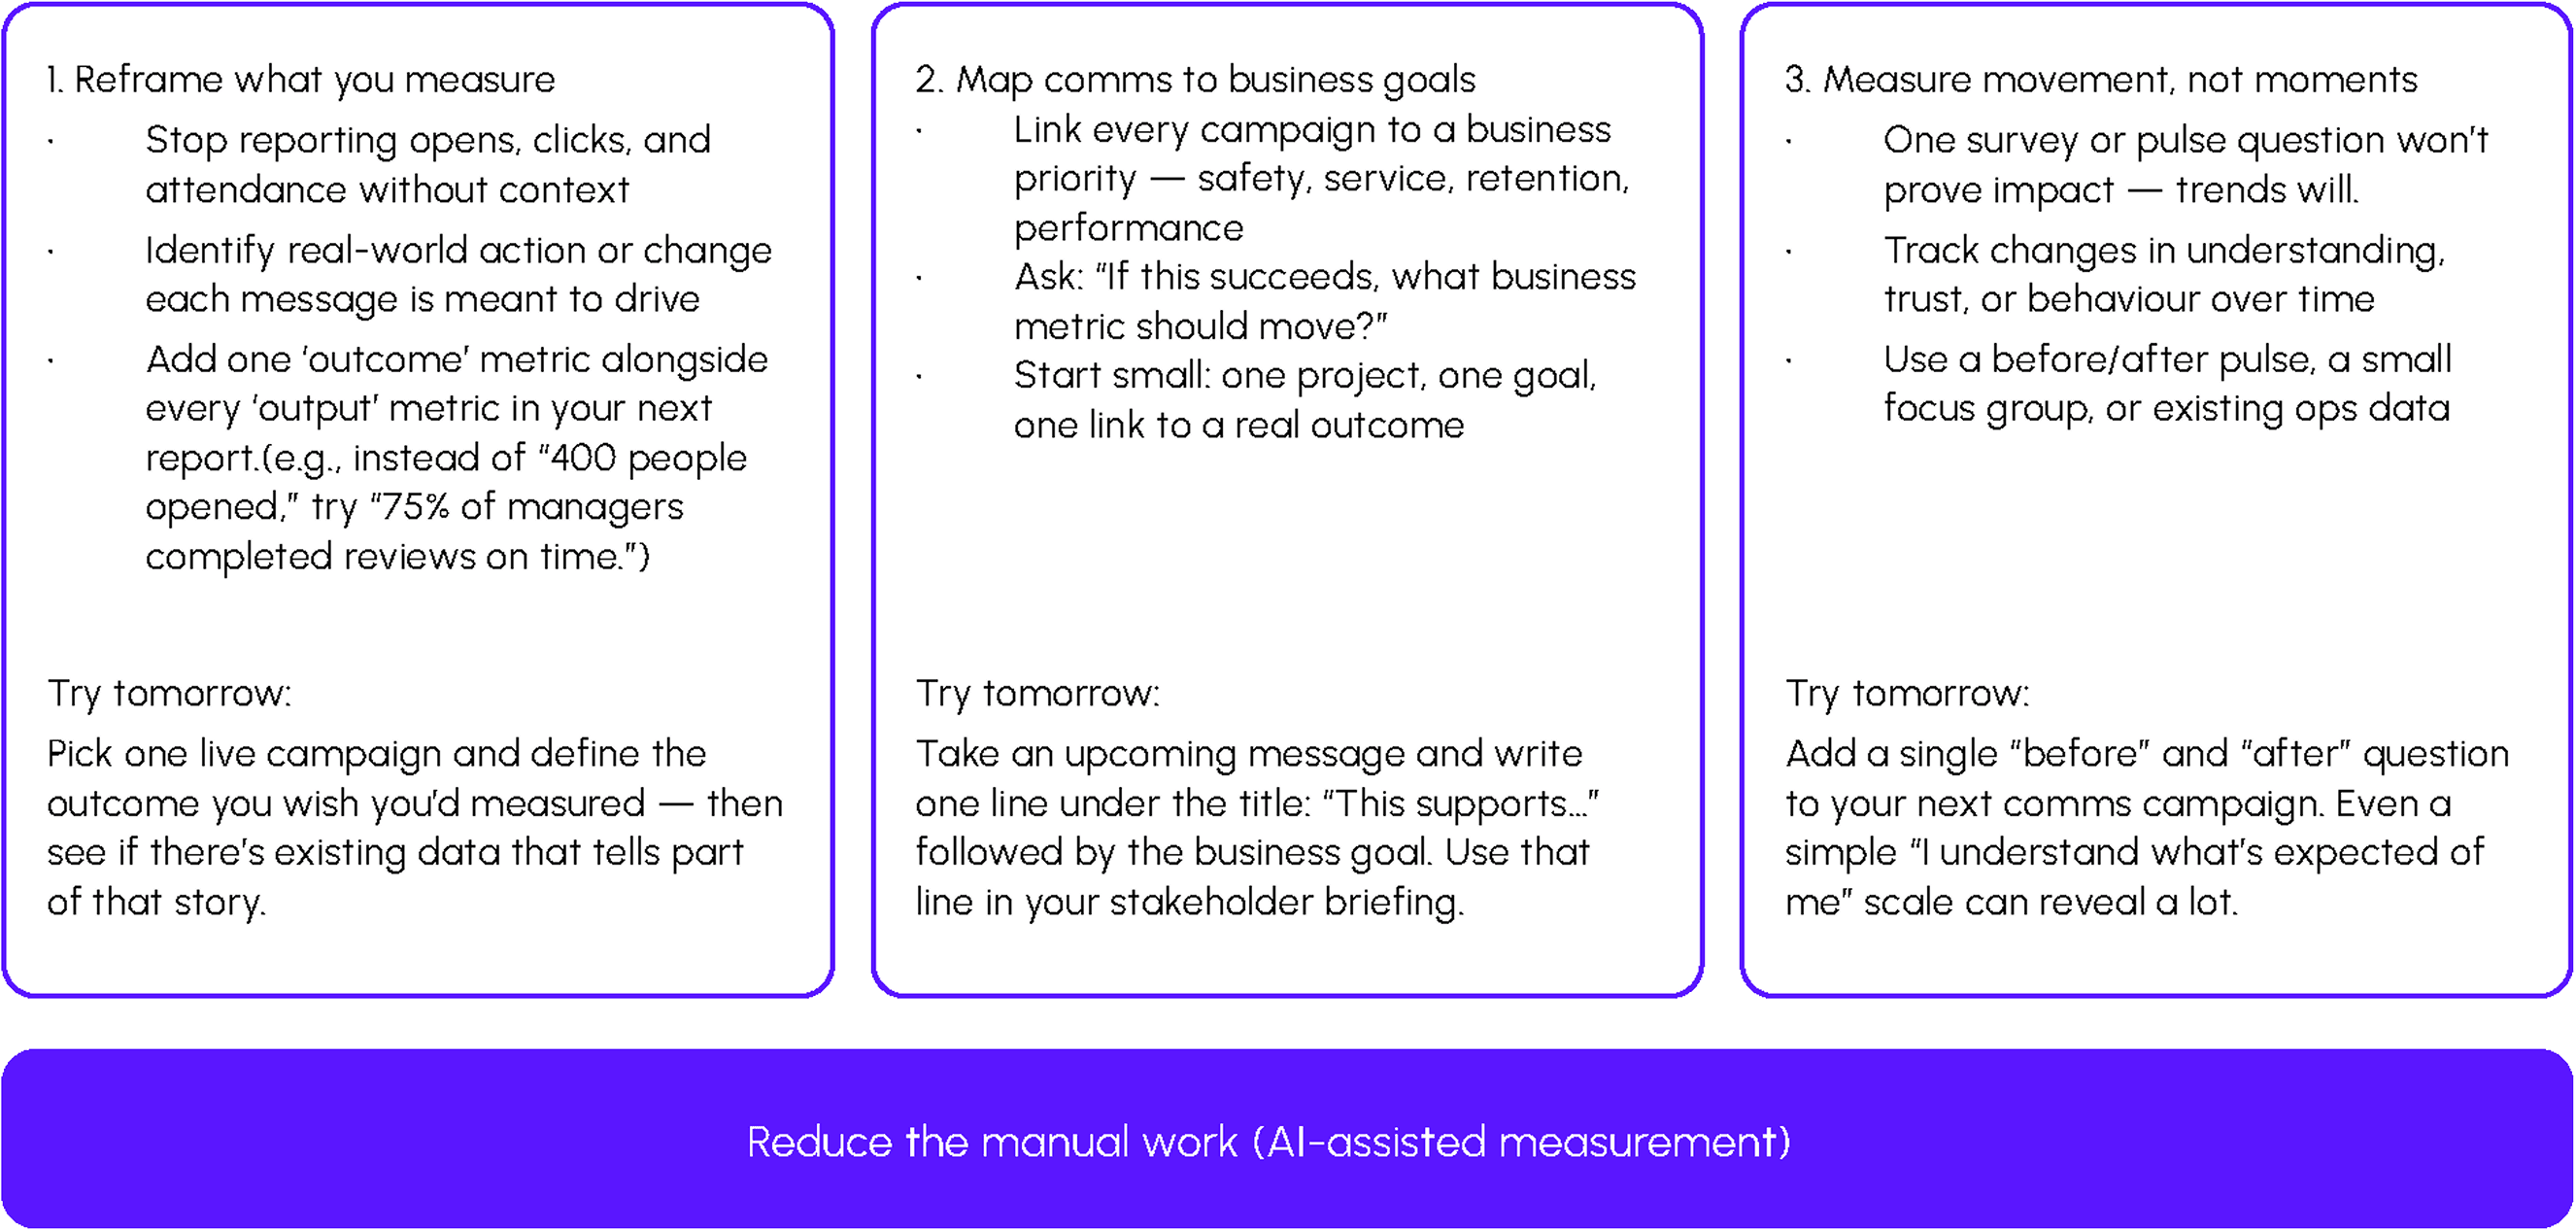
Four. Reduce the manual work where you can: shift the heavy lifting to AI.
Look for one part of your measurement process that is repetitive—pulling reports, summarizing feedback, or tracking trends—and test whether AI can reduce the manual effort. Jo argues the real opportunity is not to automate judgment, but to spend less time gathering data and more time understanding it.
Beyond this week, the bigger discipline is reflective. Run a short review at the end of each campaign—what went well, and what you’d measure differently next time. Review the measurement practice as a whole each quarter: is it still tracking the things that matter, or has it drifted back to what’s easy to count? Reflection is what turns a series of individual campaigns into something you can actually learn from.
Measure. Reflect. Influence.
Repeat. That’s the thinking done. You now have the frameworks: the Value Ladder, know/feel/do, SMART objectives, and the planning discipline that connects a business goal to a measurable outcome.
The templates, the worked example, and the sample dashboard that turn the thinking into practice.